
DaemonSet 滚动更新导致服务中断——优雅终止与 PodDisruptionBudget
场景: DaemonSet RollingUpdate 过程中旧 Pod 被 SIGTERM → 进程不优雅退出 → Prometheus 采集链路断裂 路径: Pod(优雅终止机制) → CRI(信号转发) → Node(kubelet 驱逐) → 集群(PDB 边界) 版本: K8s v1.25
上篇讲了 DaemonSet 更新策略的选择陷阱——OnDelete 和 RollingUpdate 各有适用场景。这篇我们来看 RollingUpdate 本身的一个更隐蔽的问题:更新过程中服务中断。
给 node-exporter DaemonSet 从 v1.5 升级到 v1.6,滚动更新刚启动,Prometheus 告警来了——"Targets 批量 Down 机"。不是新 Pod 没起来,是旧 Pod 里的 node-exporter 进程收到 SIGTERM 后直接退出,Prometheus 的 HTTP scrape 请求打到了正在退出的进程上,connection refused。DaemonSet controller(在每个节点上运行一个 Pod 的控制器)的默认行为是:新 Pod Ready → 终止旧 Pod。但 Ready 只保证新 Pod 在运行——不保证旧 Pod 的连接已被优雅关闭。
K8s 的 RollingUpdate 只保证 Pod 被替换——不保证连接被优雅关闭。
【坐标】→ 滚动更新期间采集链路断裂
Pod 状态:Terminating 的时间窗口
更新 node-exporter DaemonSet 后,Prometheus 面板上 Targets 开始逐节点变红。
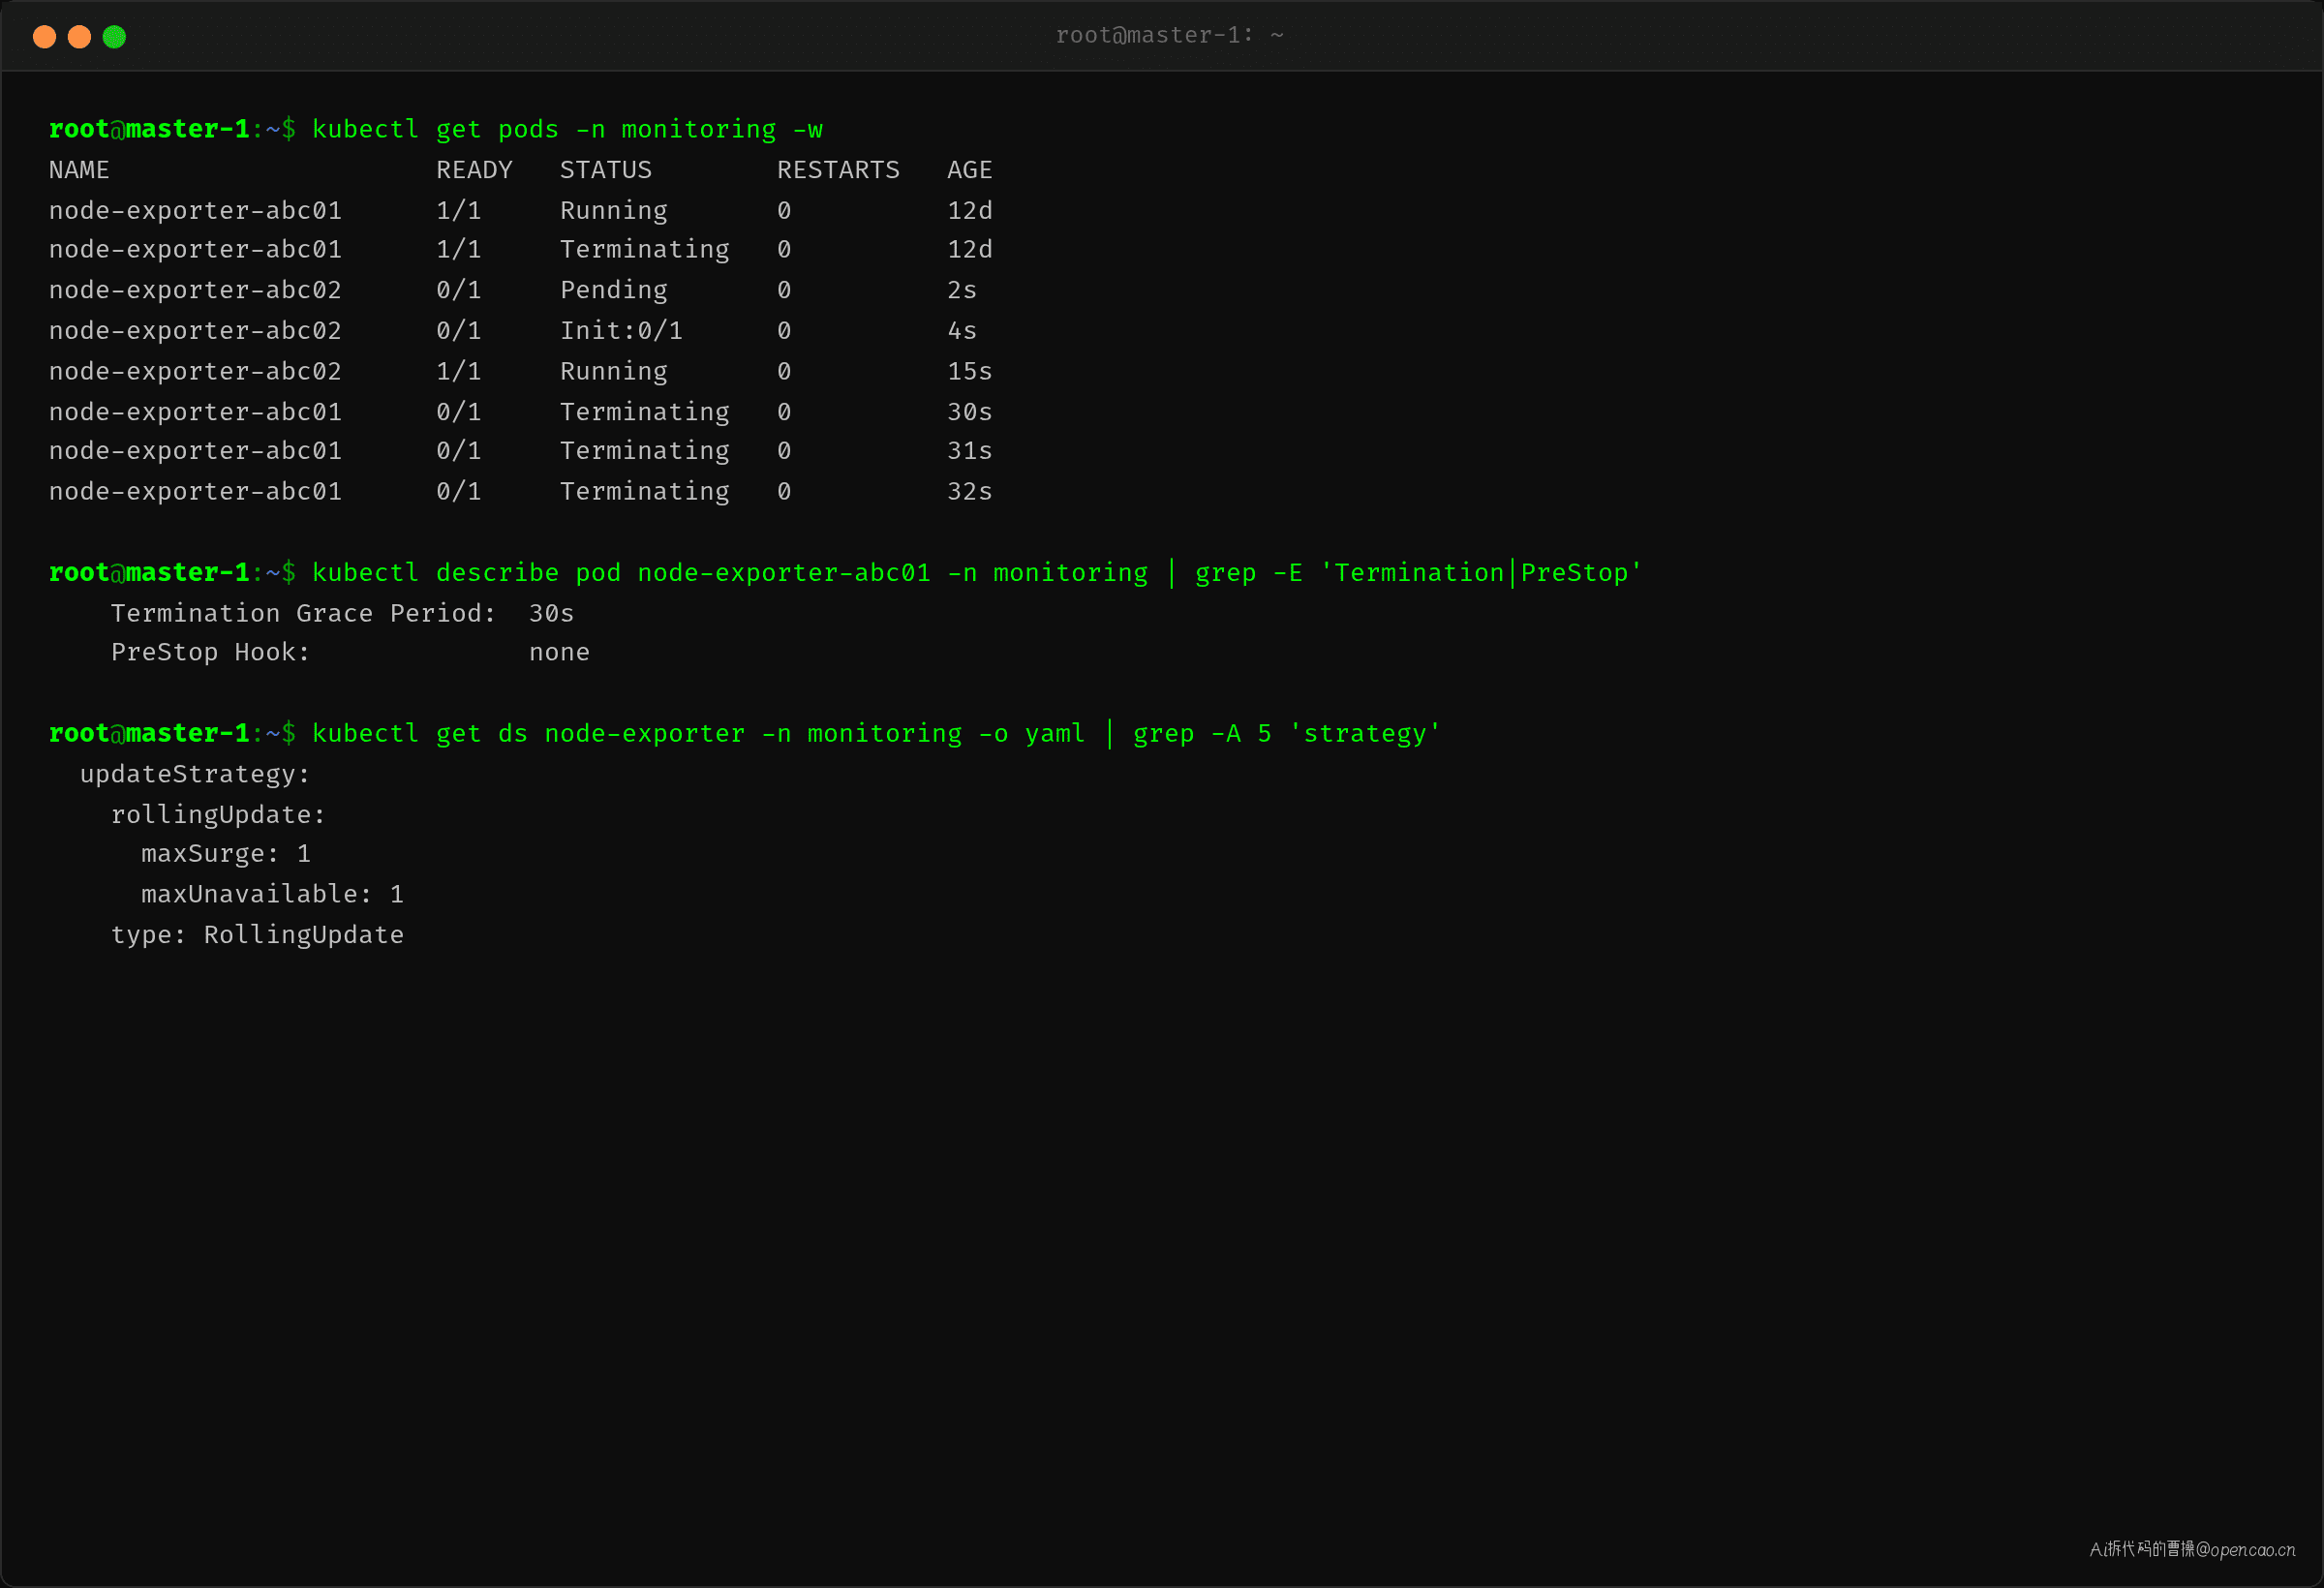
kubectl get pods -n monitoring -w 能清楚看到新旧 Pod 交替的节奏:
$ kubectl get pods -n monitoring -w
NAME                     READY   STATUS        RESTARTS   AGE
node-exporter-abc01      1/1     Running       0          12d
node-exporter-abc01      1/1     Terminating   0          12d    ← DaemonSet controller 终止旧 Pod
node-exporter-abc02      0/1     Pending       0          2s     ← 新 Pod 启动中
node-exporter-abc02      1/1     Running       0          15s    ← 新 Pod Ready
node-exporter-abc01      0/1     Terminating   0          30s    ← 旧 Pod 还在终止中
node-exporter-abc01      0/1     Terminating   0          32s    ← 超过 30s 才消失
^C
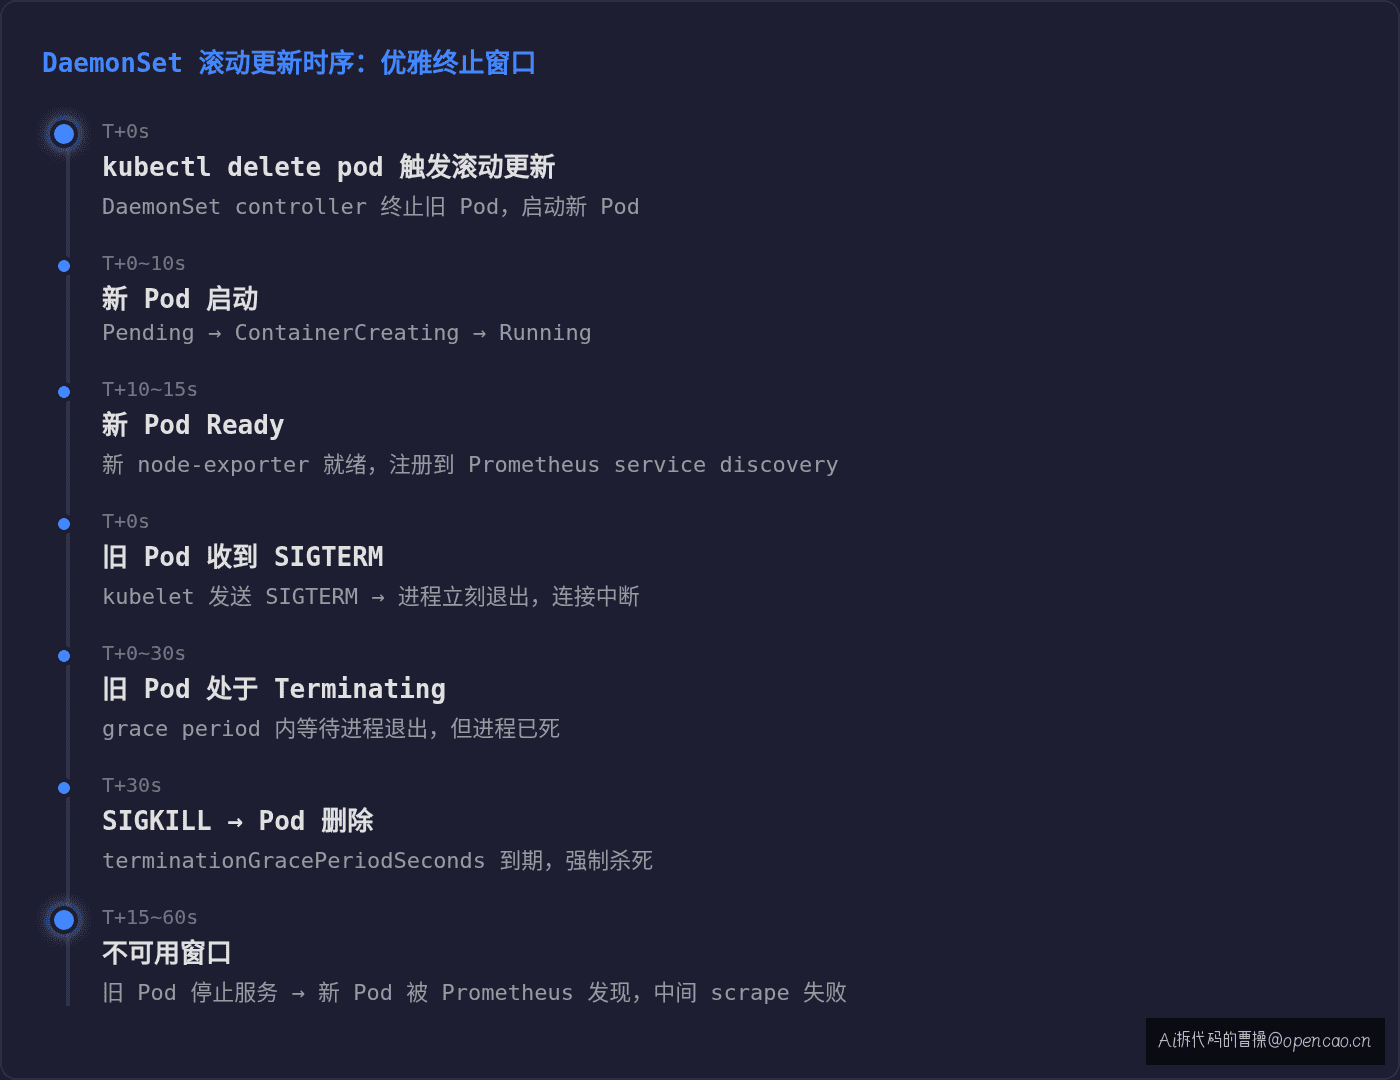
关键观察:新 Pod 在 15s 内 Ready,但旧 Pod 从 Running 到完全消失花了 32s。这多出来的 30s 就是 terminationGracePeriodSeconds(Pod 的优雅终止期限)——kubelet 发 SIGTERM 后等进程自行退出,如果 30s 内不退出,直接发 SIGKILL。
DaemonSet controller 的滚动更新逻辑是等新 Pod Ready 后再终止旧 Pod,但它不关心旧 Pod 的优雅退出是否完成。从 Prometheus 的视角看:
- 旧 Pod 收到 SIGTERM → node-exporter HTTP server 停止 → scrape 请求 connection refused
- Prometheus 标记该 target 为 Down(down 状态持续到下次 scrape 周期)
- 新 Pod Ready → Prometheus service discovery 重新发现 → scrape 恢复
- 但中间有一段空窗:旧 Pod 已死,新 Pod 还未被 Prometheus 发现
这不是 node-exporter 特有的问题——任何 DaemonSet 用 RollingUpdate 更新时,旧 Pod 的进程如果不处理 SIGTERM,都会出现这个空窗。
【分层】→ 逐层排查优雅终止链路
滚动更新的优雅终止链路涉及 4 层:Pod → CRI → Node → 集群。每层都可能成为瓶颈。
排查顺序表
| 层 | 排查对象 | 关键命令 | 重点关注 |
|---|---|---|---|
| Pod 层 | terminationGracePeriodSeconds / preStop | kubectl describe pod |
Termination Grace Period 值、PreStop Hook 有无 |
| CRI 层 | 容器运行时信号转发 | crictl inspect <cid> |
PID 1 进程是应用还是 shell、信号能否直达 |
| Node 层 | kubelet 优雅终止流程 | kubectl describe node |
节点上 Pod 驱逐状态、maxUnavailable 生效数 |
| 集群层 | PodDisruptionBudget | kubectl get pdb -o yaml |
disruptionsAllowed、PDB 是否阻止了终止 |
Pod 层:terminationGracePeriodSeconds 与 preStop
[结论] 优雅终止的起点在 Pod spec——terminationGracePeriodSeconds 定义了 kubelet 等多久才发 SIGKILL,preStop hook 决定了进程退出前做什么。默认 30s + 无 preStop = 进程收到 SIGTERM 必须自己优雅退出,否则 SIGKILL 准时到。
[证据]
查看 node-exporter Pod 的终止配置:
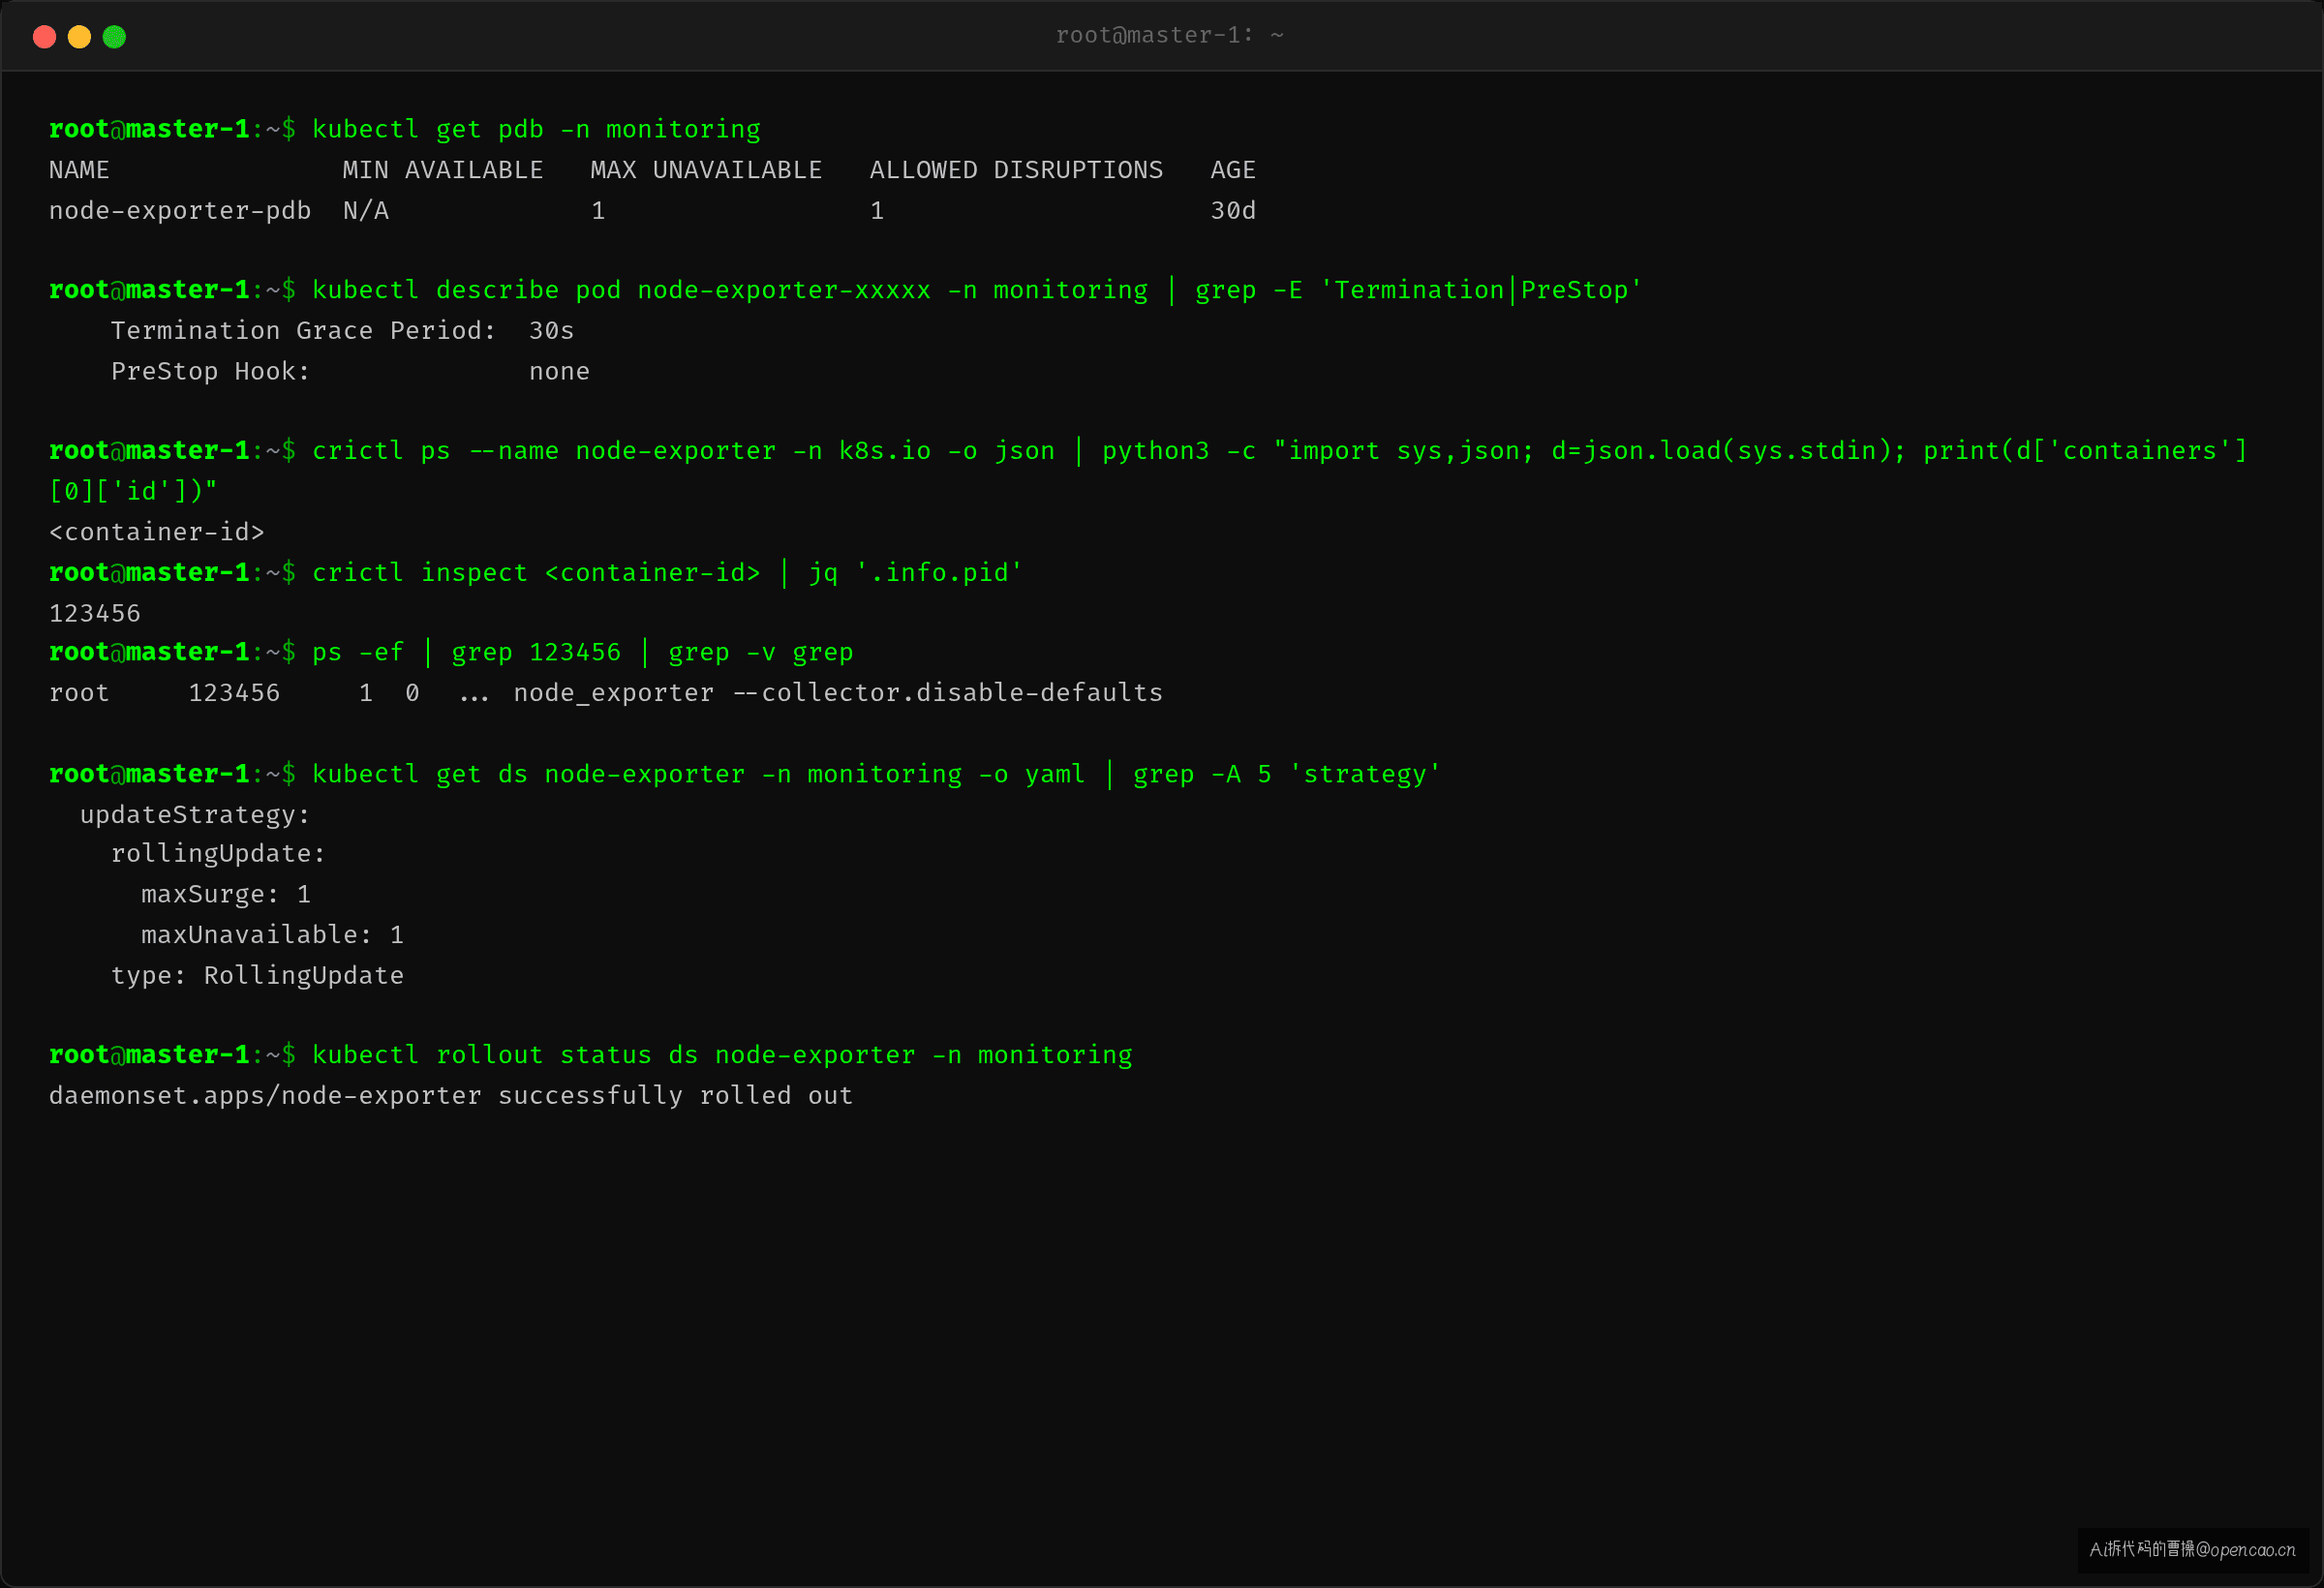
$ kubectl describe pod node-exporter-abc01 -n monitoring | grep -E 'Termination|PreStop'
    Termination Grace Period:  30s
    PreStop Hook:              none
默认值——30s 优雅期限,没有 preStop hook。再看 DaemonSet 的 update strategy:
$ kubectl get ds node-exporter -n monitoring -o yaml | grep -A 5 'strategy'
  updateStrategy:
    rollingUpdate:
      maxSurge: 1
      maxUnavailable: 1
    type: RollingUpdate
maxUnavailable: 1 限制了同时不可用的 Pod 数——这是线程安全级别的控制,但不是服务可用性级别的保证。
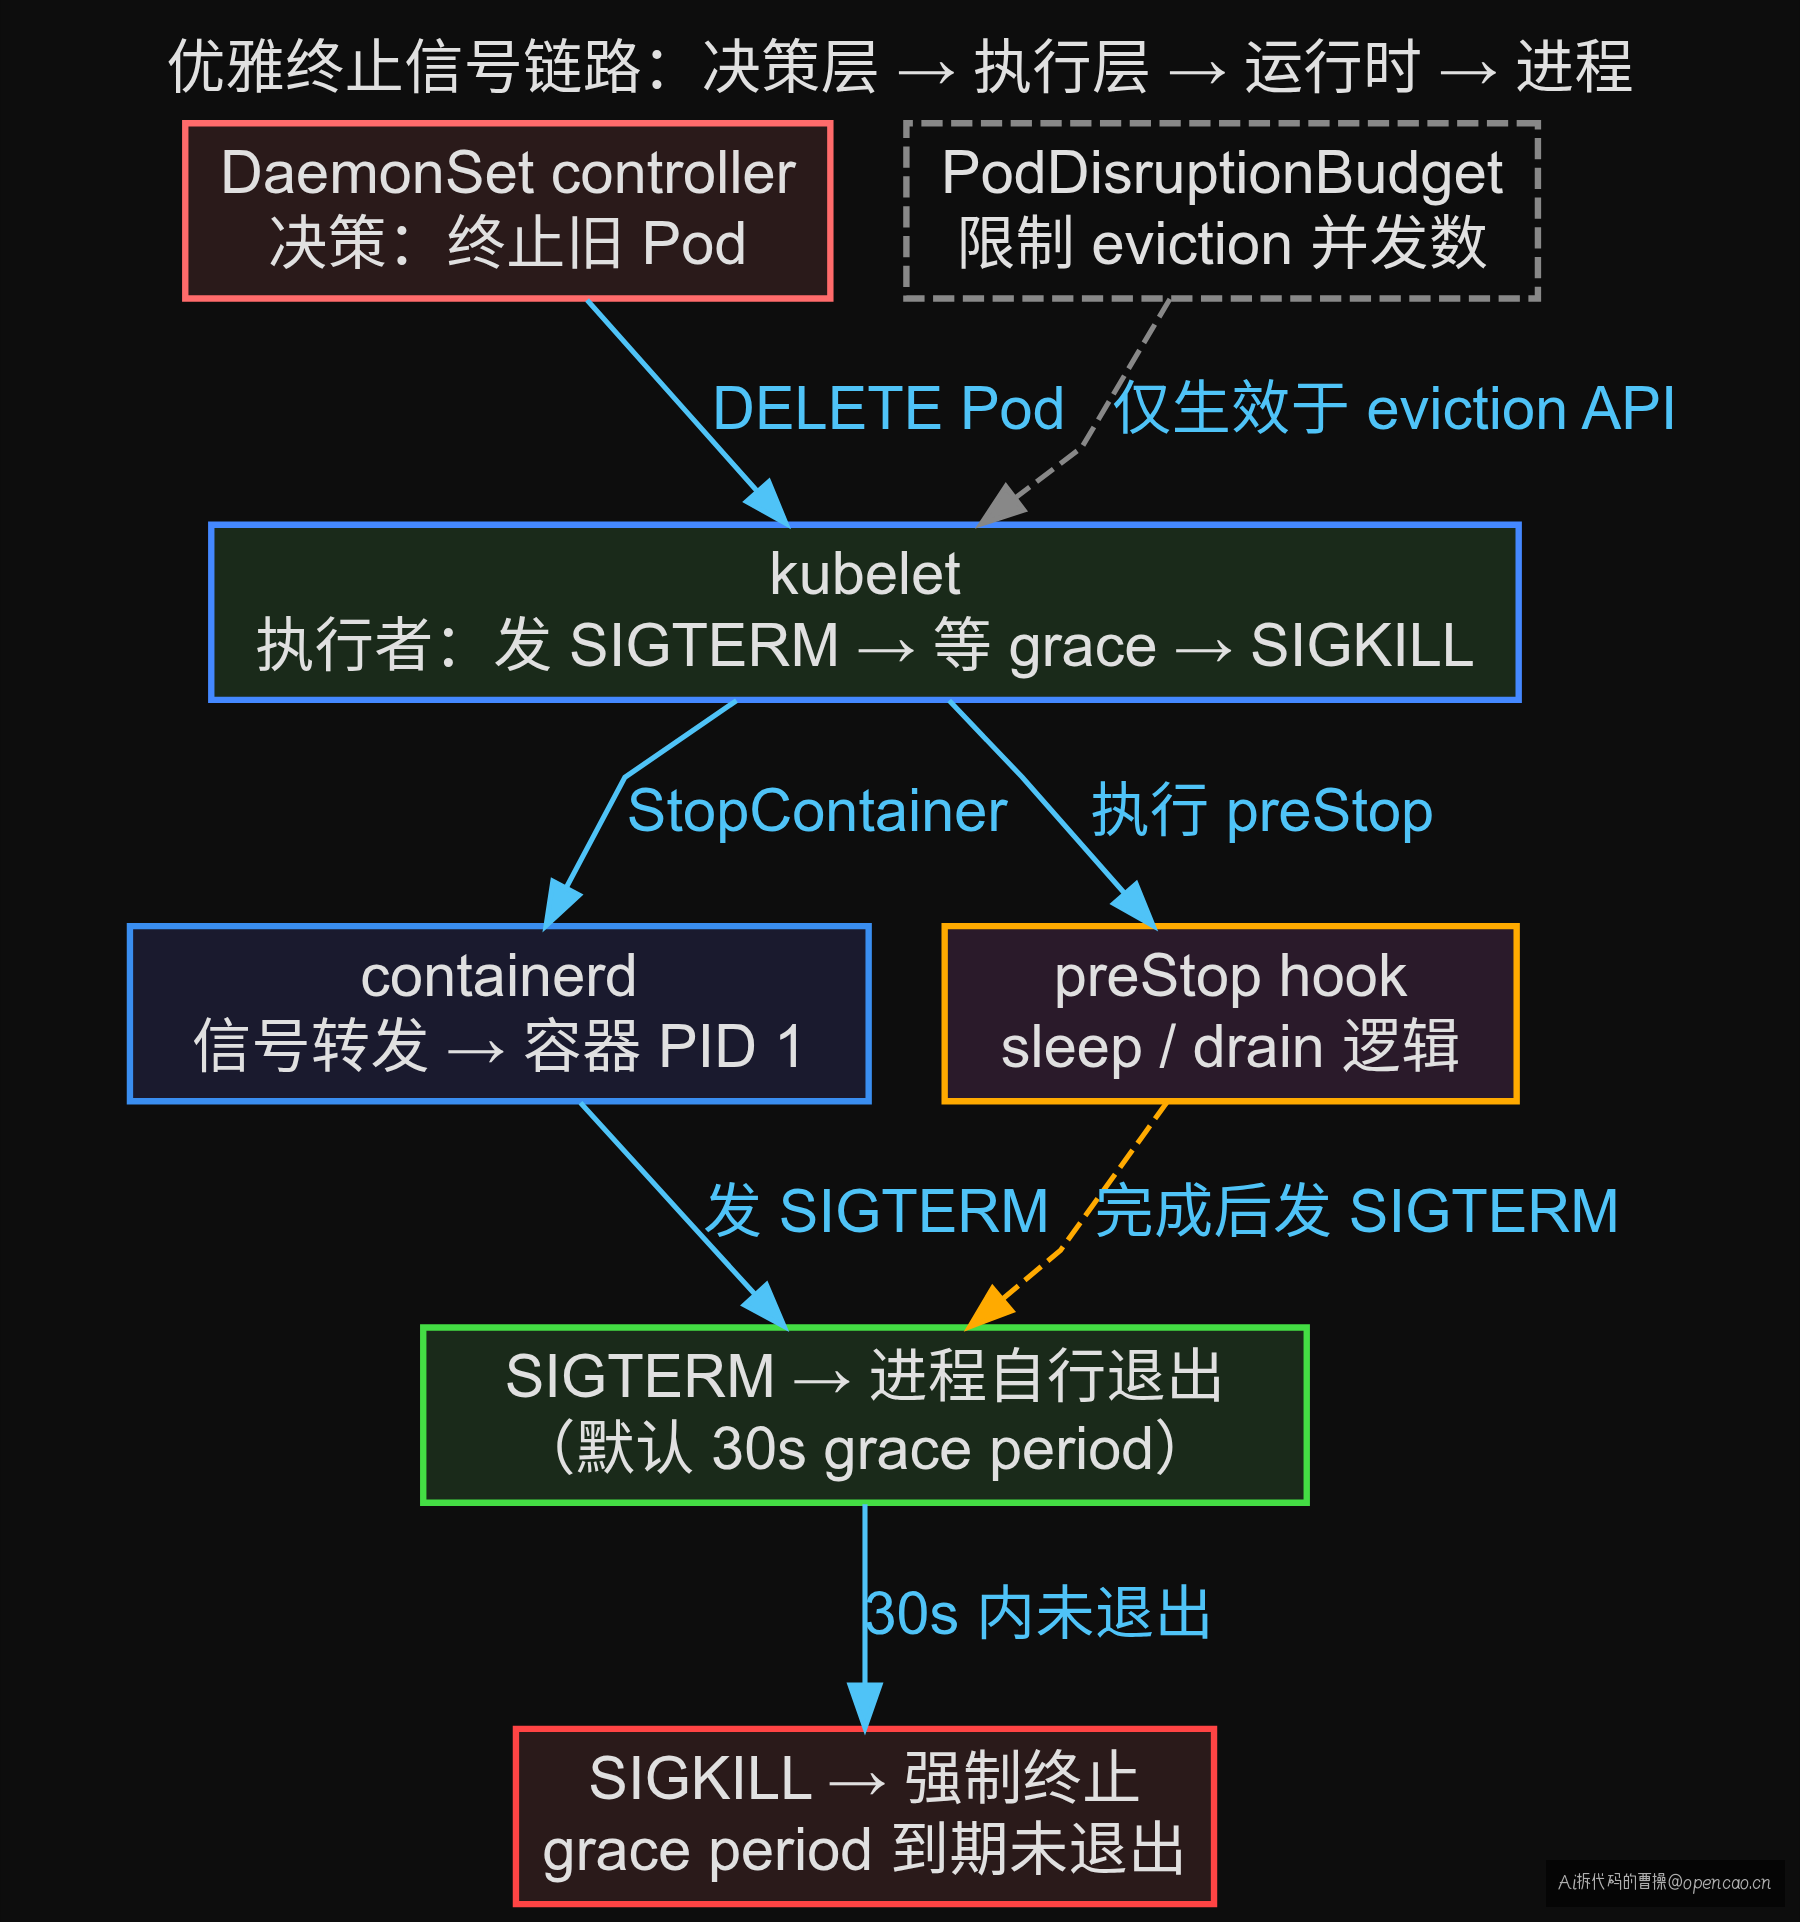
当 kubelet 收到 DELETE Pod 请求后,执行以下时序(从 K8s 源码 pkg/kubelet/kuberuntime/kuberuntime_container.go 提取):
T+0s   kubelet 收到 Pod 删除请求
T+0s   执行 preStop hook(如果有)
T+0s   向容器 PID 1 发 SIGTERM
T+0~30s 等待进程退出
T+30s  terminationGracePeriodSeconds 到期→发 SIGKILL
T+30s+ Pod 从 API Server 删除
node-exporter 的 PID 1 就是二进制本身,收到 SIGTERM 后默认行为是立刻退出——不等待正在处理的 HTTP 请求完成。Prometheus 的 scrape 请求正好打到这个窗口,就是 connection refused。
[衔接] Pod 层只定义了"等多久"——但信号能不能正确到达进程,还取决于 CRI 层怎么转发。
CRI 层:容器运行时如何转发信号
[结论] containerd(当前 K8s 默认 CRI 实现)会把 kubelet 的 SIGTERM 发给容器内的 PID 1。但如果 entrypoint 是 shell 脚本(sh -c),shell 不会把信号转发给子进程。PID 1 是 shell,收到 SIGTERM 直接退出——子进程变成孤儿进程继续运行,等到 grace period 结束被 SIGKILL 杀死。
[证据]
用 crictl 检查容器内的进程结构:
$ crictl ps --name node-exporter -n k8s.io -o json | \
  python3 -c "import sys,json; d=json.load(sys.stdin); print(d['containers'][0]['id'])"
<container-id>

$ crictl inspect <container-id> | jq '.info.pid'
123456
看宿主上这个容器的进程树:
$ ps -ef | grep 123456
root     123456     1  0  ... node_exporter --collector.disable-defaults
PID 1 是 node_exporter 二进制——没有 shell 包装,信号直达。这是好的情况。
但如果 Dockerfile 写的是 ENTRYPOINT ["sh", "-c", "node_exporter ..."],PID 1 是 shell 而非 node_exporter:
$ ps -ef | grep <cid>
root     123456     1  0  ... sh -c node_exporter --collector.disable-defaults
root     123457  123456  0  ... node_exporter --collector.disable-defaults
PID 1 是 shell(123456),子进程是 node_exporter(123457)。当 SIGTERM 到达 PID 1:
- Shell 收到 SIGTERM → 自己退出(不转发信号给子进程)
- 子进程 node_exporter 变成孤儿进程 → 被 init 接管
- Kubelet 等 30s → grace period 到期 → 发 SIGKILL → 杀死整个 cgroup
这个过程虽然最终进程会被杀,但失去了优雅终止的机会——子进程没有收到 SIGTERM,无法做任何退出前清理。30s 的 grace period 被白白浪费。
[衔接] 信号能正确到达进程后,下一层是 Node 层的 kubelet——它是优雅终止的实际执行者。
Node 层:kubelet 的优雅终止执行者
[结论] kubelet 负责执行 Pod 优雅终止的全流程:接收 DELETE 请求 → 发 SIGTERM → 等 grace period → 发 SIGKILL。它不关心进程是否优雅退出——只关心时限。Pod 的 terminationGracePeriodSeconds 和 lifecycle.preStop 是它执行终止的依据。
[证据]
DaemonSet 的 maxUnavailable 控制 Node 层同时终止多少个 Pod。默认值 1——逐节点更新,一次只终止 1 个 Pod,等新 Pod Ready 后再终止下一个。
$ kubectl get ds node-exporter -n monitoring -o yaml | grep -A 5 'rollingUpdate'
  rollingUpdate:
    maxSurge: 1
    maxUnavailable: 1
时间窗口叠加问题:当旧 Pod 进入 Terminating 状态,它算作不可用;新 Pod 还没 Ready 也算不可用。这两个阶段在时间上可能重叠:
从「旧 Pod 停止服务」到「新 Pod 被 Prometheus service discovery 发现」,中间有一个窗口两个 Pod 都不可用。maxUnavailable: 1 保证了这个窗口每次只有 1 个节点受影响——但不能消除它。
[衔接] Node 层的 maxUnavailable 控制了并发数——但它不区分 Pod 终止的原因。对于自愿中断(滚动更新算自愿中断),集群层的 PDB 提供了额外的保护语义。
集群层:PodDisruptionBudget 的边界
[结论] PodDisruptionBudget(PDB,Pod 中断预算)是 K8s 提供的自愿中断保护机制。它限制通过 eviction 子资源(pods/eviction)发起的 Pod 终止操作。但 DaemonSet controller 的 RollingUpdate 使用的是直接 DELETE API——不走 eviction 子资源,PDB 拦不住。
这是最常见的误解之一:很多人以为 PDB 能保护 DaemonSet 滚动更新,但它不能。
[证据]
查看当前集群中是否配置了 PDB:
$ kubectl get pdb -A
NAMESPACE    NAME               MIN AVAILABLE   MAX UNAVAILABLE   ALLOWED DISRUPTIONS   AGE
monitoring   node-exporter-pdb  N/A             1                 1                     30d
PDB 的生效路径:
请求类型              → 检查 PDB? → 适用场景
pods/eviction API    → ✅ 是      → kubectl drain、Cluster Autoscaler、手动 evict
pods/delete API      → ❌ 否      → DaemonSet RollingUpdate、Deployment 更新、直接删除
为什么 PDB 不拦 DaemonSet 的 DELETE?因为 DaemonSet controller 用的是普通的 Pod DELETE API——API Server 不会对 DELETE 请求做 PDB 检查。PDB 只在 eviction 子资源上做准入检查。
PDB 的真正作用:当你对节点执行 kubectl drain(排空节点)或 Cluster Autoscaler 尝试缩容时,这些操作使用 eviction API——PDB 会检查 allowed disruptions 是否够用,不够就阻止终止。PDB 防止的是"一次性太多 Pod 被自愿中断",但滚动更新的并发控制已经由 DaemonSet 的 maxUnavailable 完成了。
PDB 的边界总结:
| 场景 | PDB 是否生效 | 理由 |
|---|---|---|
| DaemonSet RollingUpdate | ❌ 不生效 | 使用 DELETE API,不走 eviction |
| Deployment 滚动更新 | ❌ 不生效 | 同样使用 DELETE API |
| kubectl drain 排空节点 | ✅ 生效 | 使用 eviction API |
| Cluster Autoscaler 缩容 | ✅ 生效 | 使用 eviction API |
| 手动 kubectl evict | ✅ 生效 | 使用 eviction API |
[衔接] 四层排查下来,核心结论浮出水面:DaemonSet 滚动更新的服务中断不是 PDB 能解的——它是 Pod 层优雅终止机制的问题。
【路径】→ 🔍 核心排查命令与异常判断
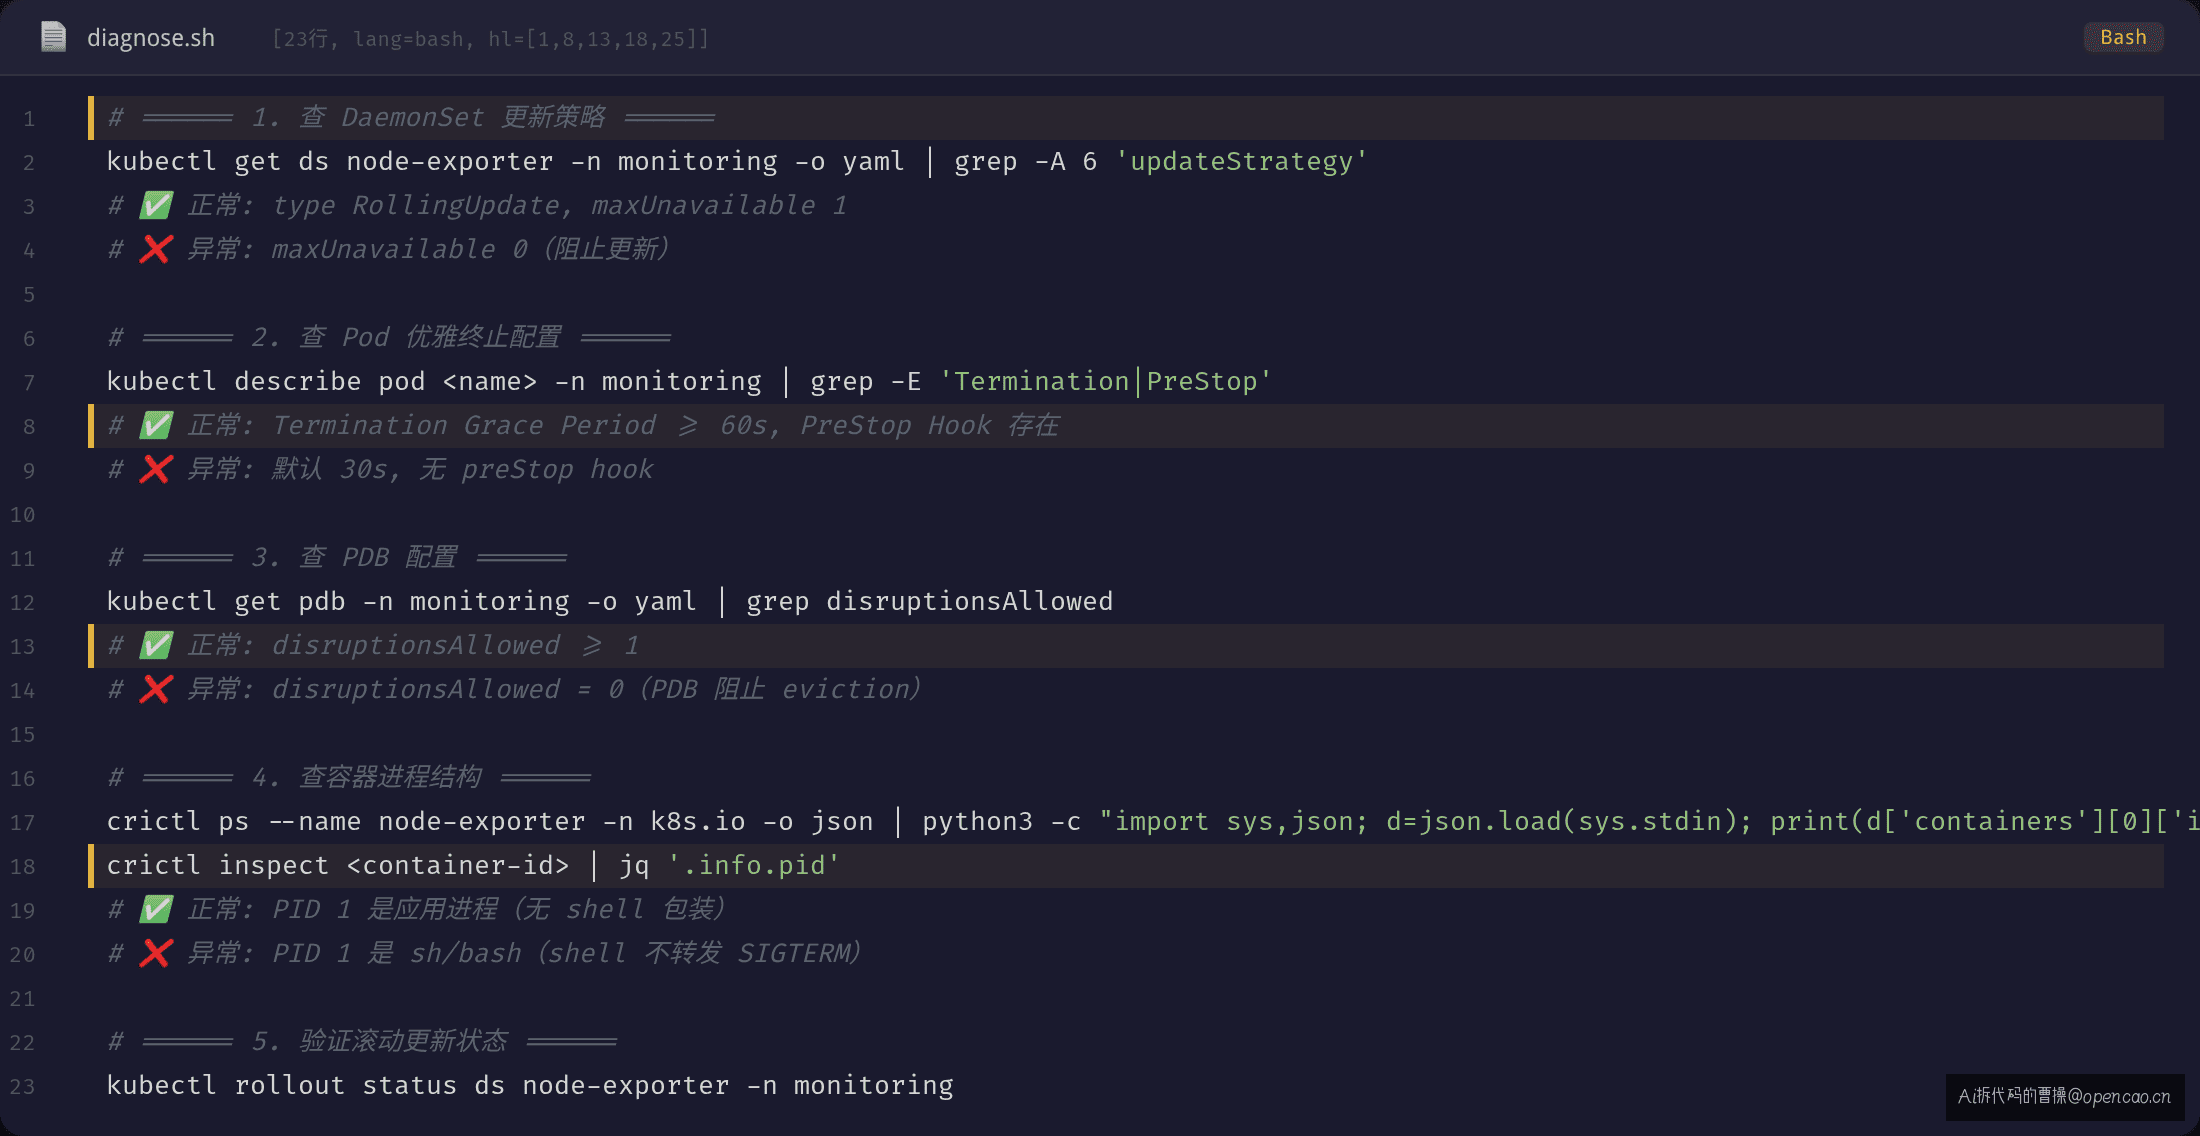
遇到 DaemonSet 滚动更新导致服务中断时,按以下顺序排查:
命令 1:查 DaemonSet 更新策略
$ kubectl get ds node-exporter -n monitoring -o yaml | grep -A 6 'updateStrategy'
  updateStrategy:
    rollingUpdate:
      maxSurge: 1
      maxUnavailable: 1
    type: RollingUpdate
✅ 正常:type: RollingUpdate,maxUnavailable 为 1 或合理百分比(每次只中断 1 个 Pod)
❌ 异常:maxUnavailable: 0 或 0%(阻止一切更新),或 type: OnDelete 但预期是滚动更新
命令 2:查 Pod 优雅终止配置
$ kubectl describe pod node-exporter-xxxxx -n monitoring | grep -E 'Termination|PreStop'
    Termination Grace Period:  30s
    PreStop Hook:              none
✅ 正常:terminationGracePeriodSeconds ≥ 应用排空所需时间,且有 preStop hook(Sleep 或 drain 逻辑)
❌ 异常:原值 30s(默认)且无 preStop hook——如果应用排空需要 60s,30s 一到就被 SIGKILL
命令 3:查 PDB 配置
$ kubectl get pdb -n monitoring -o yaml | grep -A 3 'disruptionsAllowed\|currentHealthy\|expectedPods'
status:
  disruptionsAllowed: 1
  currentHealthy: 20
  expectedPods: 20
✅ 正常:disruptionsAllowed ≥ 1——PDB 允许执行终止操作
❌ 异常:disruptionsAllowed: 0——PDB 阻止了 eviction 操作(如果你用的是 drain 而非 RollingUpdate)
📌 注意:即使 disruptionsAllowed: 1,也不保证 DaemonSet RollingUpdate 不出问题——PDB 对 DELETE 请求无效
【定位】→ 最常误判
❌ 错误排查方向
"滚动更新导致服务中断?给 DaemonSet 加个 PDB 就行。"
为什么这是错的:PDB 只检查 eviction API,不检查 DELETE API。DaemonSet controller 的 RollingUpdate 走 DELETE 路径——PDB 管不到。加了 PDB 但问题依旧——因为 PDB 根本就没参与到 RollingUpdate 的流程中。
更隐蔽的误判:把"并发"问题当成了"优雅退出"问题。
当更新导致服务中断时,第一反应通常是"更新节奏太快了,一次终止太多 Pod"。于是调小 maxUnavailable(从 0% 调整到 10%?但原来就是 1)或者加 PDB。如果根因是"单个 Pod 退出时进程不优雅",减速只能拉长问题窗口——不能消除它。
❌ 错误归因:"同时终止的 Pod 太多了,服务扛不住"
→ 修复:加 PDB / 调小 maxUnavailable
→ 结果:问题还在,只是发生频率降低

✅ 正确归因:"单个 Pod 退出时进程不处理 SIGTERM,连接没排空就被杀"
→ 修复:加 preStop hook / 进程注册 SIGTERM handler / 调大 grace period
→ 结果:每个 Pod 退出时连接被优雅排空,问题消除
✅ 正确排查思路
排查顺序清晰——从进程开始,逐层往上:
排查顺序:
① Pod 层:terminationGracePeriodSeconds 够不够?有没有 preStop hook?
② CRI 层:PID 1 是应用进程还是 shell?信号能不能直达?
③ Node 层:maxUnavailable 是否合理?是否需要调小?
④ 集群层:PDB 是否已配置?用于保护节点 drain 等场景
三层优雅终止 + PDB 是最后一道防线。PDB 保护的是"节点 drain"场景,不是 RollingUpdate 场景。
一句话金句:PDB 是交通管制——它不让太多车同时上路,但不保证每辆车安全到达终点。进程不处理 SIGTERM,PDB 也拦不住 SIGKILL。
【标点】→ 修复 + Check-list
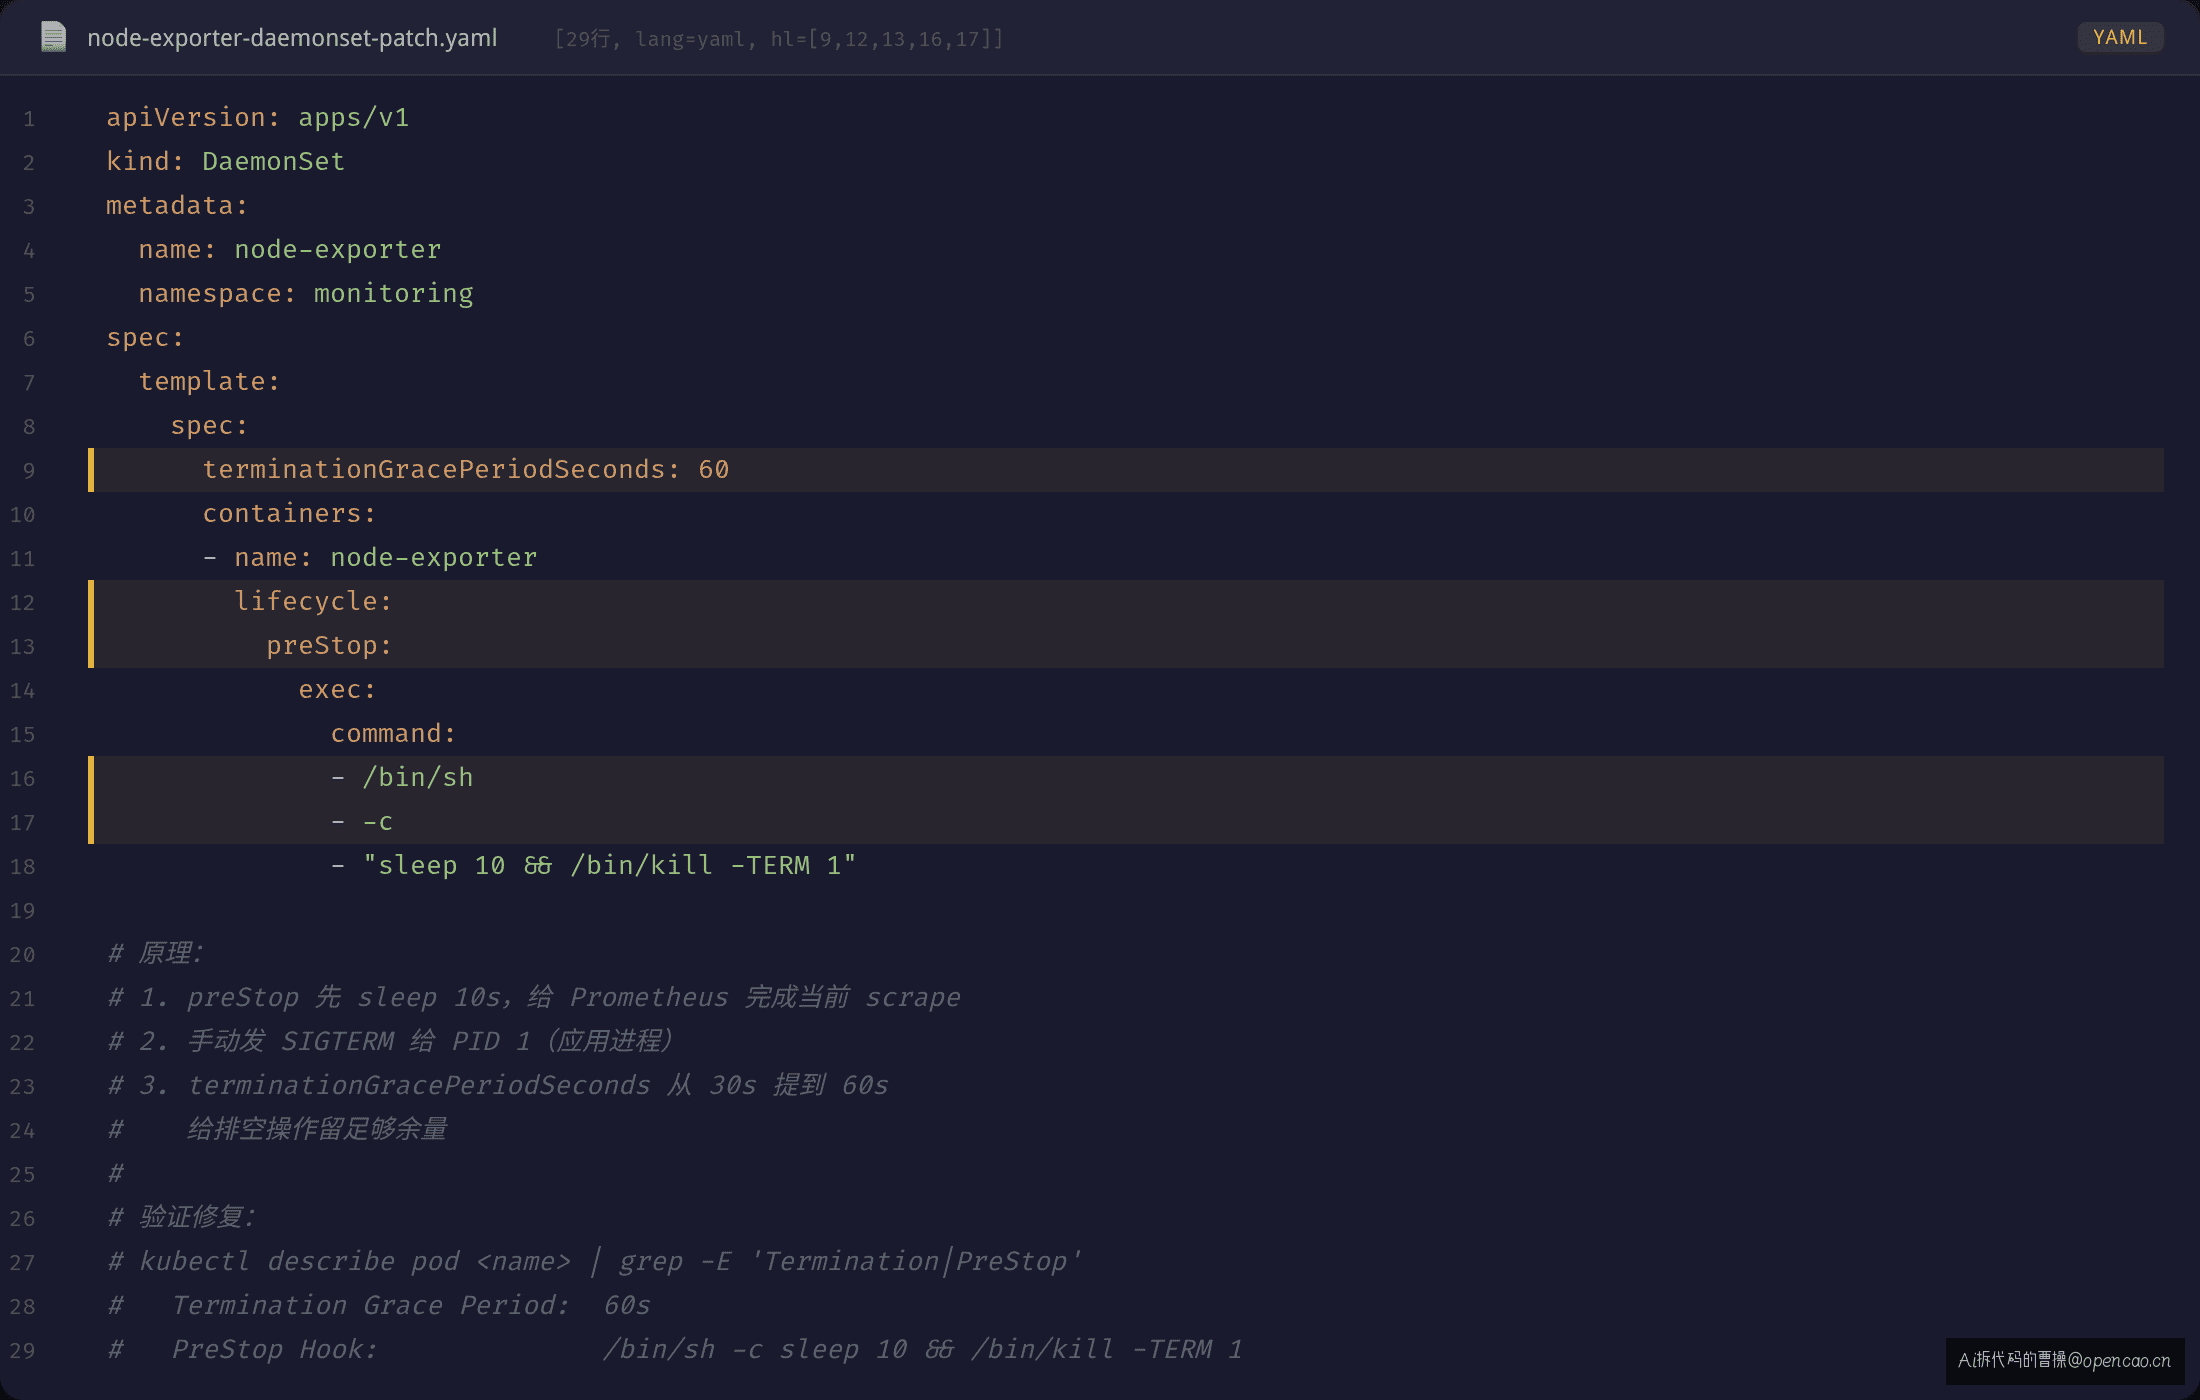
修复方案 A:preStop hook + 调大 grace period(推荐,0 代码改动)
不改应用代码,在 DaemonSet 的 Pod spec 加 preStop hook,让 kubelet 在发 SIGTERM 之前先等一段时间,给现存连接排空时间:
apiVersion: apps/v1
kind: DaemonSet
spec:
  template:
    spec:
      terminationGracePeriodSeconds: 60    # 从 30s 提到 60s
      containers:
      - name: node-exporter
        lifecycle:
          preStop:
            exec:
              command:
              - /bin/sh
              - -c
              - "sleep 10 && /bin/kill -TERM 1"
原理:preStop hook 在 SIGTERM 之前执行——先等 10s,让 Prometheus 完成当前 scrape 周期,再手动发 SIGTERM 给 PID 1。terminationGracePeriodSeconds 从 30s 提到 60s,给排空留足够余量。
修复方案 B:应用进程注册 SIGTERM handler(需改应用代码)
应用注册 SIGTERM 信号处理器,收到信号后按序执行: 1. 停止接受新请求(deregister from service discovery / close listener) 2. 排空连接池(等待 in-flight 请求完成) 3. 刷写最终数据(flush buffer / write checkpoint) 4. 正常退出
// 伪代码示例
sigs := make(chan os.Signal, 1)
signal.Notify(sigs, syscall.SIGTERM)

go func() {
    <-sigs
    log.Println("收到 SIGTERM,开始优雅退出...")
    server.Shutdown(context.WithTimeout(ctx, 20*time.Second))
    db.Close()
    os.Exit(0)
}()
方案 A(preStop)是快速修复,方案 B(SIGTERM handler)是根本解法。
修复方案 C:PDB 联合防护(保护节点 drain 场景)
apiVersion: policy/v1
kind: PodDisruptionBudget
metadata:
  name: node-exporter-pdb
  namespace: monitoring
spec:
  maxUnavailable: 1
  selector:
    matchLabels:
      app.kubernetes.io/name: node-exporter
PDB 虽然不拦 RollingUpdate,但拦节点 drain。组合拳:preStop + terminationGracePeriodSeconds 保证单个 Pod 优雅退出,PDB 保证大规模节点维护时的中断可控。
Check-list(每条对应一个 kubectl 命令)
□ kubectl get ds <name> -n <ns> -o yaml | grep -A 6 'updateStrategy'
  → 确认 type 为 RollingUpdate,maxUnavailable 不为 0
□ kubectl describe pod <name> -n <ns> | grep -E 'Termination|PreStop'
  → 确认 terminationGracePeriodSeconds ≥ 排空所需时间
  → 确认有 preStop hook(sleep / drain 逻辑)
□ kubectl get pdb -A -o wide
  → 确认 DaemonSet 对应的 PDB 存在
□ kubectl get pdb <name> -n <ns> -o yaml | grep disruptionsAllowed
  → 确认 disruptionsAllowed ≥ 1
□ kubectl rollout status ds <name> -n <ns>
  → 确认滚动更新正常推进,无卡住
附:完整命令清单
# DaemonSet 更新策略
kubectl get ds <name> -n <ns> -o yaml | grep -A 6 'updateStrategy'

# Pod 优雅终止配置
kubectl describe pod <name> -n <ns> | grep -E 'Termination|PreStop'

# PDB 配置查询
kubectl get pdb -A -o wide
kubectl get pdb <name> -n <ns> -o yaml

# 容器进程结构检查(确认 PID 1 不是 shell)
crictl ps --name <name> -n k8s.io -o json | \
  python3 -c "import sys,json; d=json.load(sys.stdin); print(d['containers'][0]['id'])"
crictl inspect <container-id> | jq '.info.pid'

# Pod 状态实时观察
kubectl get pods -n <ns> -w

# DaemonSet 滚动更新状态
kubectl rollout status ds <name> -n <ns>

# DaemonSet 滚动更新历史
kubectl rollout history ds <name> -n <ns>
故障排查的终点不是修好了——是把排查路径写成 check-list。滚动更新导致服务中断时,先别急着加 PDB,先查 Pod 里的进程有没有好好说再见。
下篇我们聊 Job/CronJob 未按预期执行的问题——时区配置错误导致定时任务跑错时间,并发策略设错导致多个 Job 同时执行。
📺 公众号「Ai拆代码的曹操」 🌟 知识星球「Ai拆代码的曹操」